So you have a WordPress site and you are expecting a spike of traffic to it. Do you know when your site will fall over? How many users can be browsing it at once and still have a good experience? If you can’t answer these questions then you need to load test your site! Through the course of this article I’ll use a new load testing tool by Kernl to test enabling WP Super Cache on Kernl’s blog. Kernl WordPress load testing doesn’t require any coding or load testing experience and by the end you’ll know how to test any performance optimizations of your WordPress site.
What is Kernl.us?
Kernl.us is a WordPress developer tool service. It does a lot of different things to help WordPress developers be more productive including:
- Plugin & Theme updates for premium products (things that can’t be put in to the WordPress repository due to GPL constraints).
- License management
- Continuous deployment via GitLab, GitHub, & BitBucket
- Feature flags
- …and now WordPress load testing!
What we’re going to focus on is the WordPress load testing portion of Kernl. Most WordPress developers never really consider load testing for a number of different reasons. Maybe they think that their site can handle lots of load already or perhaps they don’t know know where to start with load testing. Luckily Kernl can help with both of those problems.
So lets get started! The Kernl blog runs on a $5/month Digital Ocean droplet. It has 1GB of RAM and 1 CPU. It runs your typical LAMP setup (Linux, Apache, MySQL, PHP 7). In general this setup is not known to scale well out of the box and requires quite a bit of tweaking to be performant. For this blog post though we’re only going to add a caching plugin and see how that changes performance.
Getting Started
Before starting any WordPress performance optimizations we need to know what our current WordPress performance characteristics look like. Kernl makes this a 2 step process:
- Create a template – Kernl uses the WP JSON API to fetch your site’s layout. It then creates a load test template that you can tweak based on the data that it fetched. A template simply tells Kernl what routes it should test and also how frequently it should visit a given route.
- Start a load test – Once you have a template you can start a load test. The load test reads the template, spins up the load testing infrastructure, and then reports back the status of the load test.
For each load test we’re going to throw traffic at https://blog.kernl.us using the following parameters:
- 200 users
- 10 minute duration
- 2 users per second spawn rate
- Traffic will be produced from Digital Ocean‘s London data center. Kernl’s blog is hosted in Digital Ocean’s NYC3 (New York City) data center.
The Template
The template that we used for this blog post looks like this:

As you can see its pretty straight forward. Each route it accompanied by a multiplier. The multiplier simply tells the load test software how much traffic it should send to a given route relative to the other routes. So in the example above the “/” route has a 3x multiplier. That means it will receive 3x as much traffic as any of the other 1x routes.
Baseline Load Test

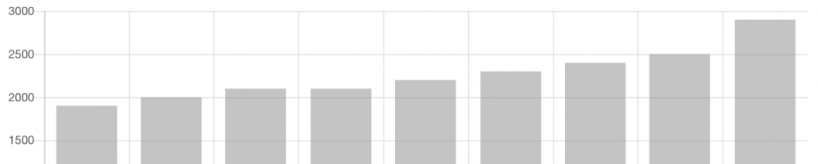
For the baseline load test we can see that within 30 seconds or so we hit our peak throughput. After that some portion of the LAMP stack starts to get overwhelmed and can only handle processing 2 requests per second. 2 requests per second is not great performance.
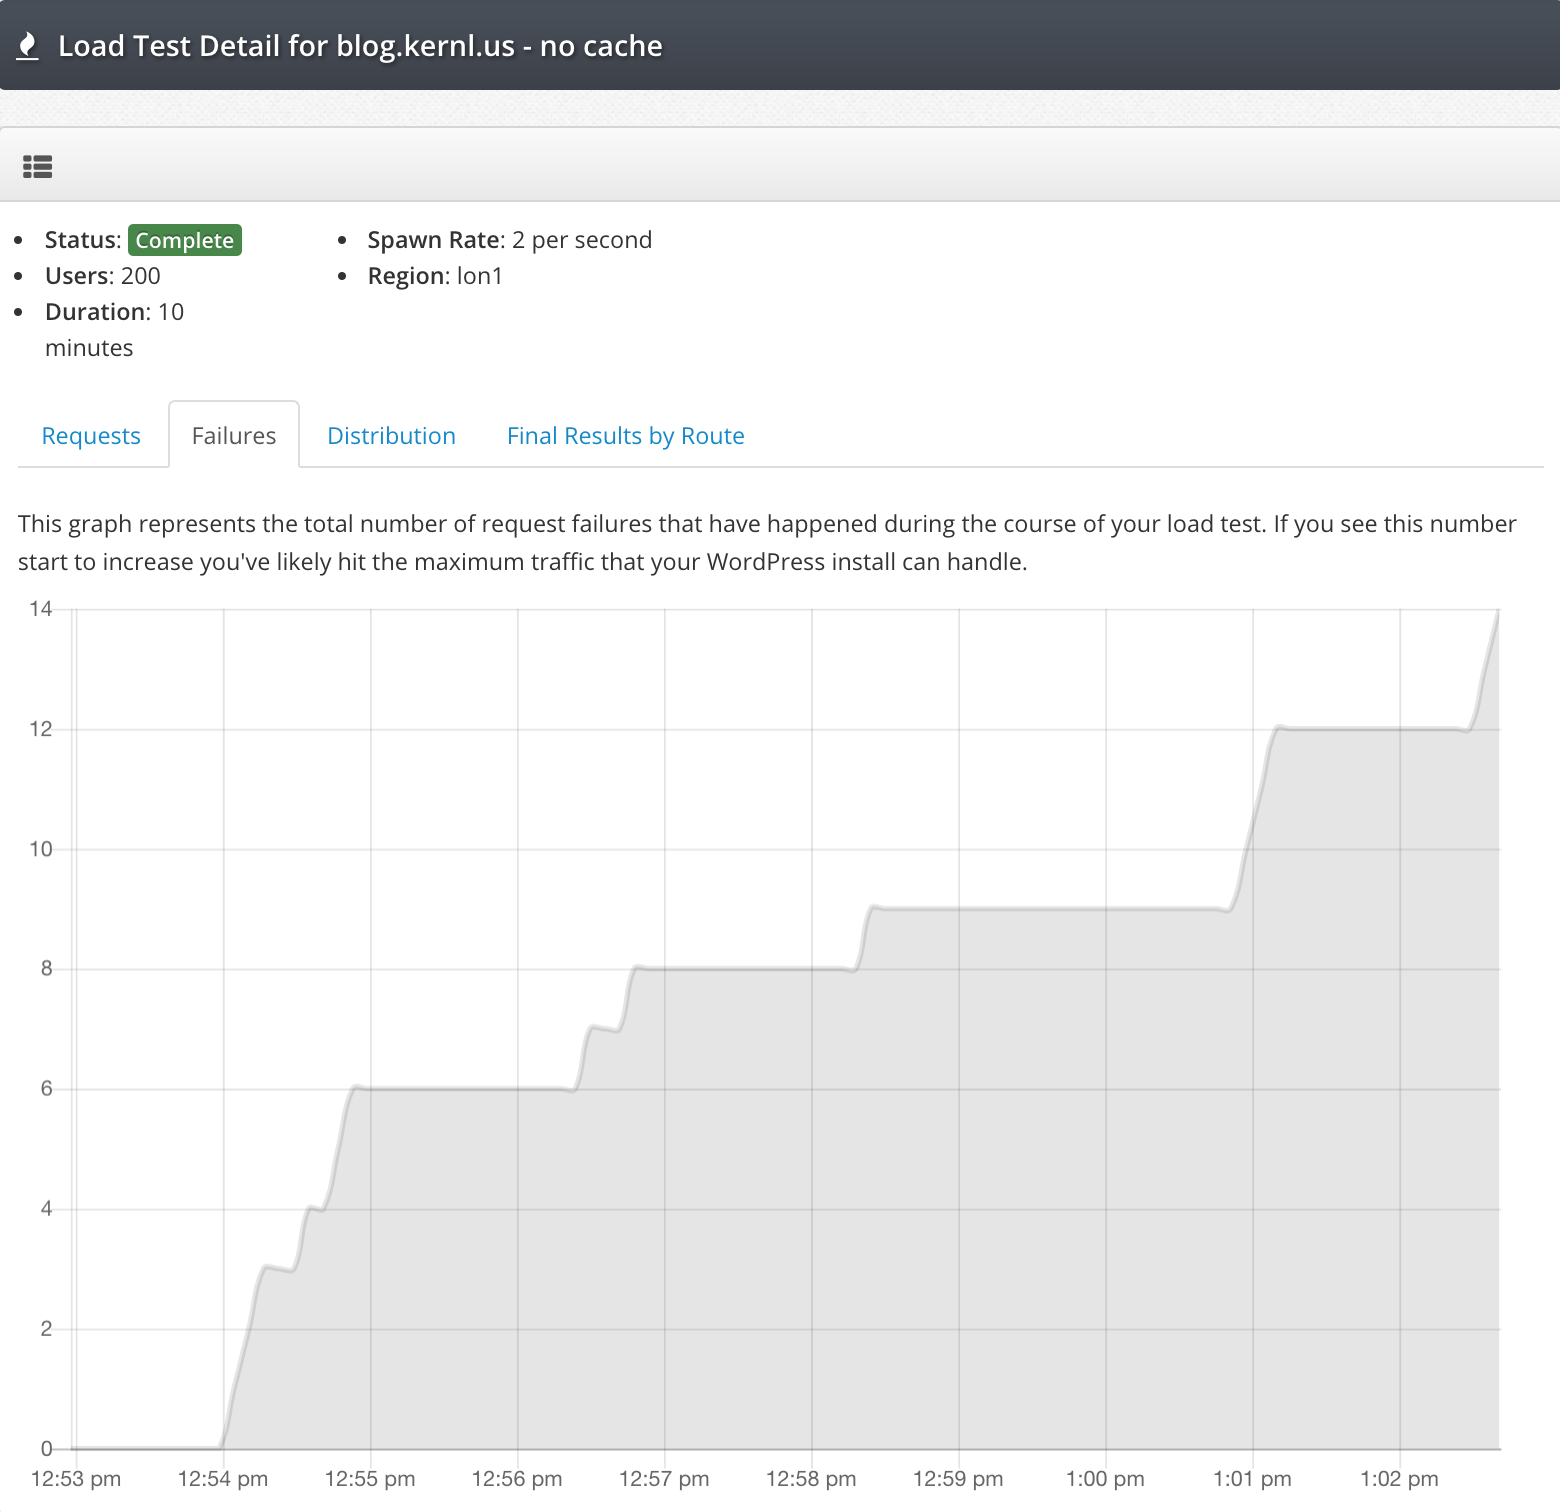
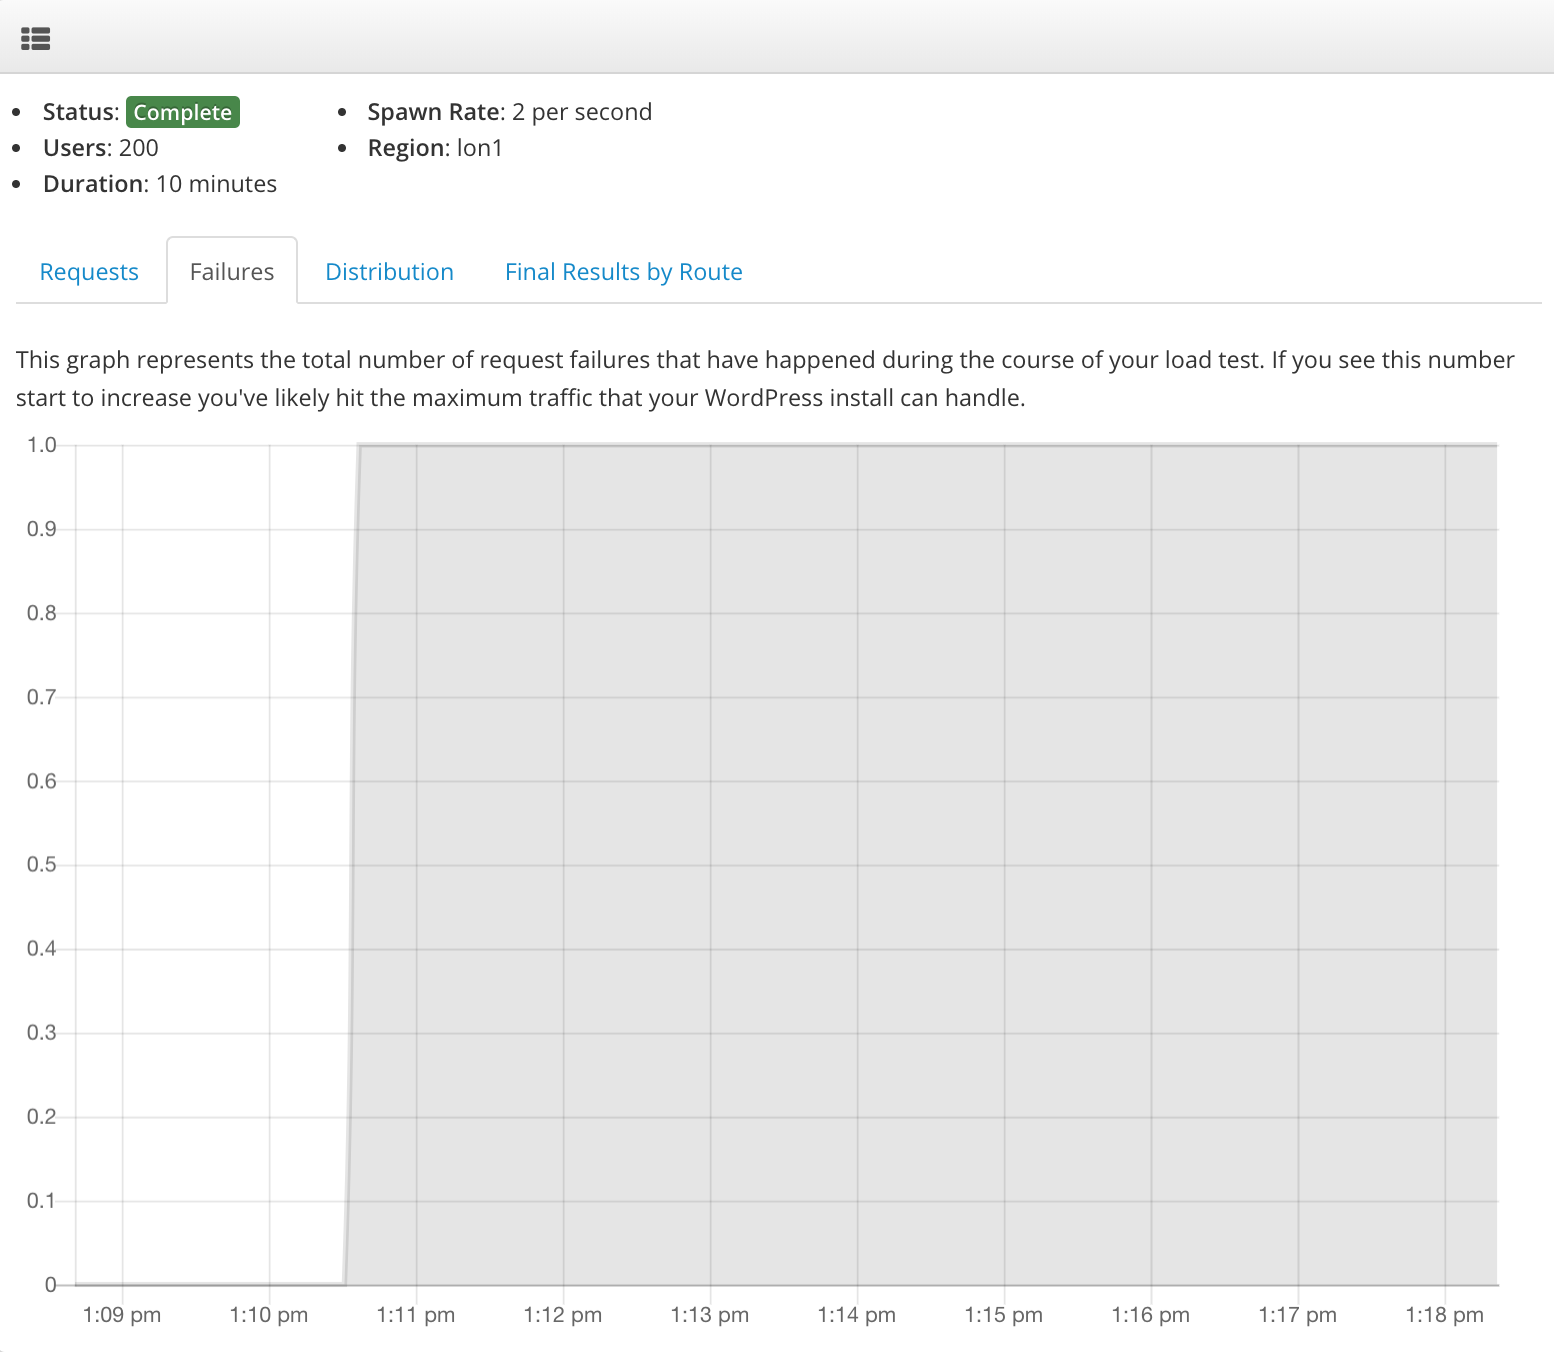
You can see from the failure graph that at right around the time the requests graph slows down to 2 requests/s failures start to occur. If you start to see your failure graph climb like this you’ll know that you’ve reached your maximum capacity.
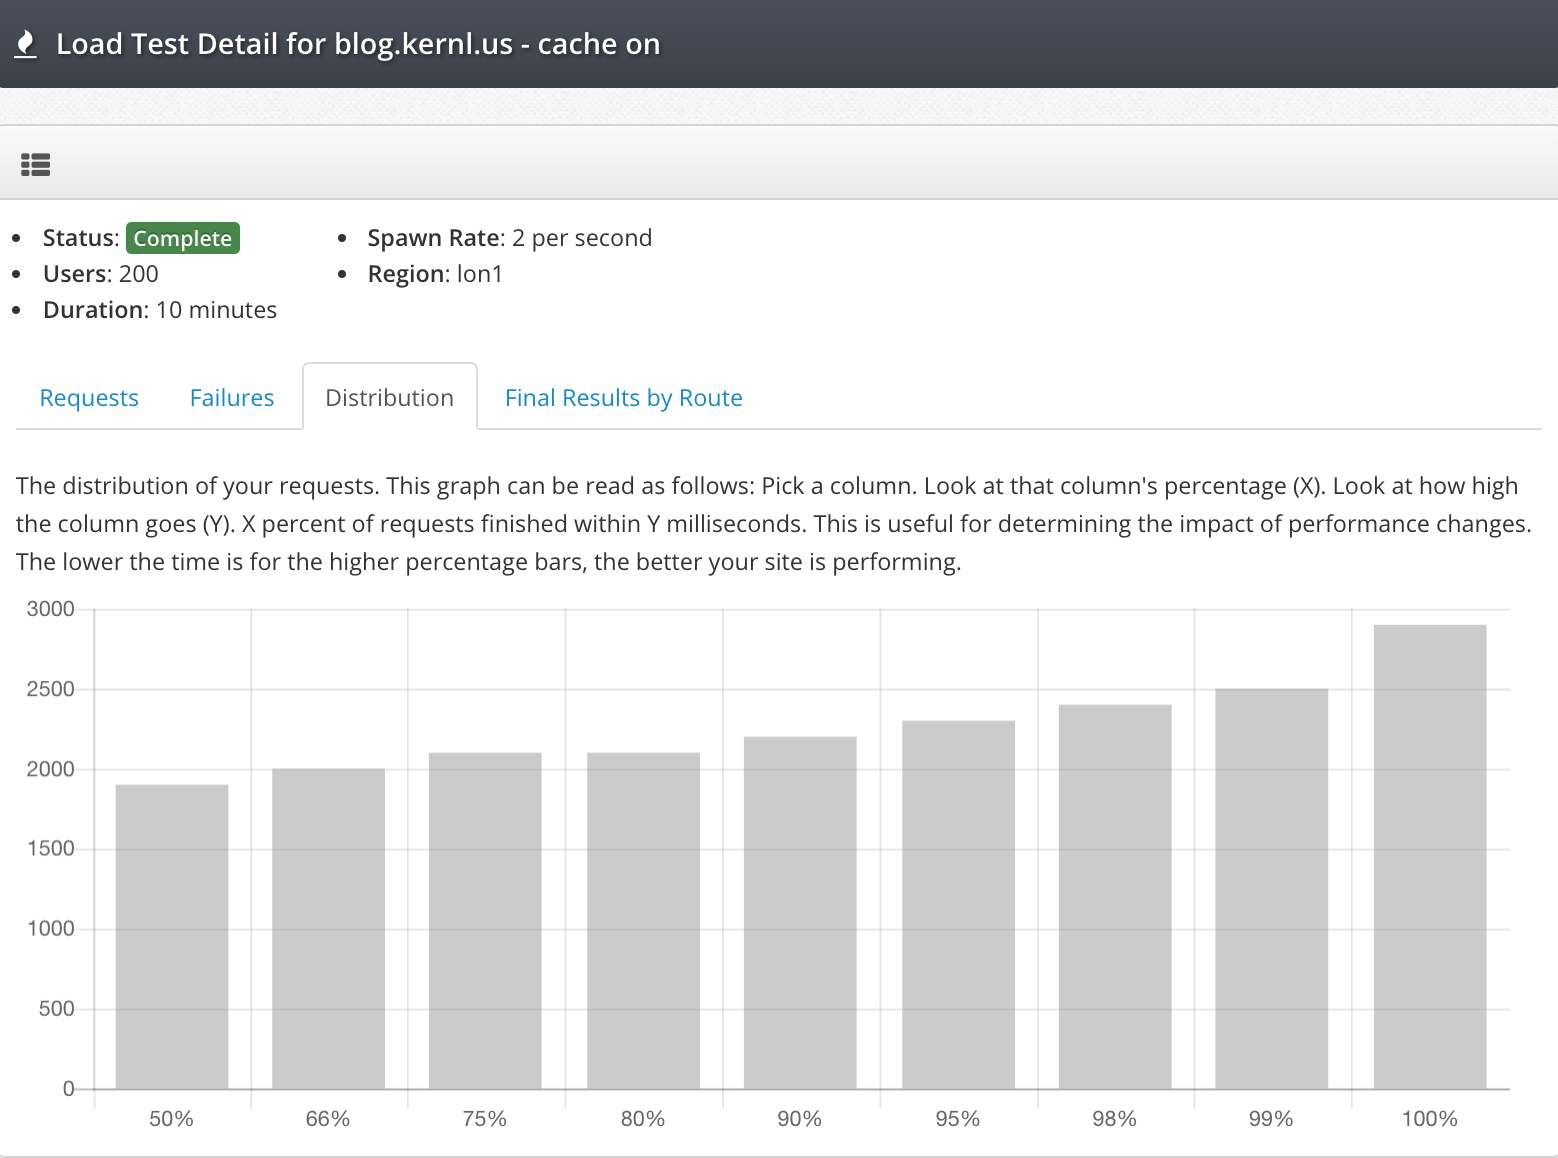
The last and most important part of the baseline load test is the request distribution graph. This graph tells us a lot about how users experience our site when it is under load.

This graph can be a little confusing to read at first, but isn’t bad at all once you get the hang of it. Read it like this:
- Pick a column. We’ll use the “90%” column.
- Now read the value of the column. The value is milliseconds.
- Combine your knowledge! 90% of requests were completed in 110000 milliseconds (110 seconds).
In the context of this load test this is a really bad user experience. If you look at the 50% column you can see that it’s hovering around 70000 milliseconds (70 seconds). This means that 50% of all traffic in the load test took at least 70 seconds to complete 🙁
Cache Enabled Load Test
Now that the baseline load test is complete we can enable a caching plugin and see how much better it makes our site perform! For this test we’re using the excellent WP Super Cache plugin. To make sure we were comparing performance in an “apples to apples” manner, we’re going to use the exact same Kernl load test configuration as we did for the first test.
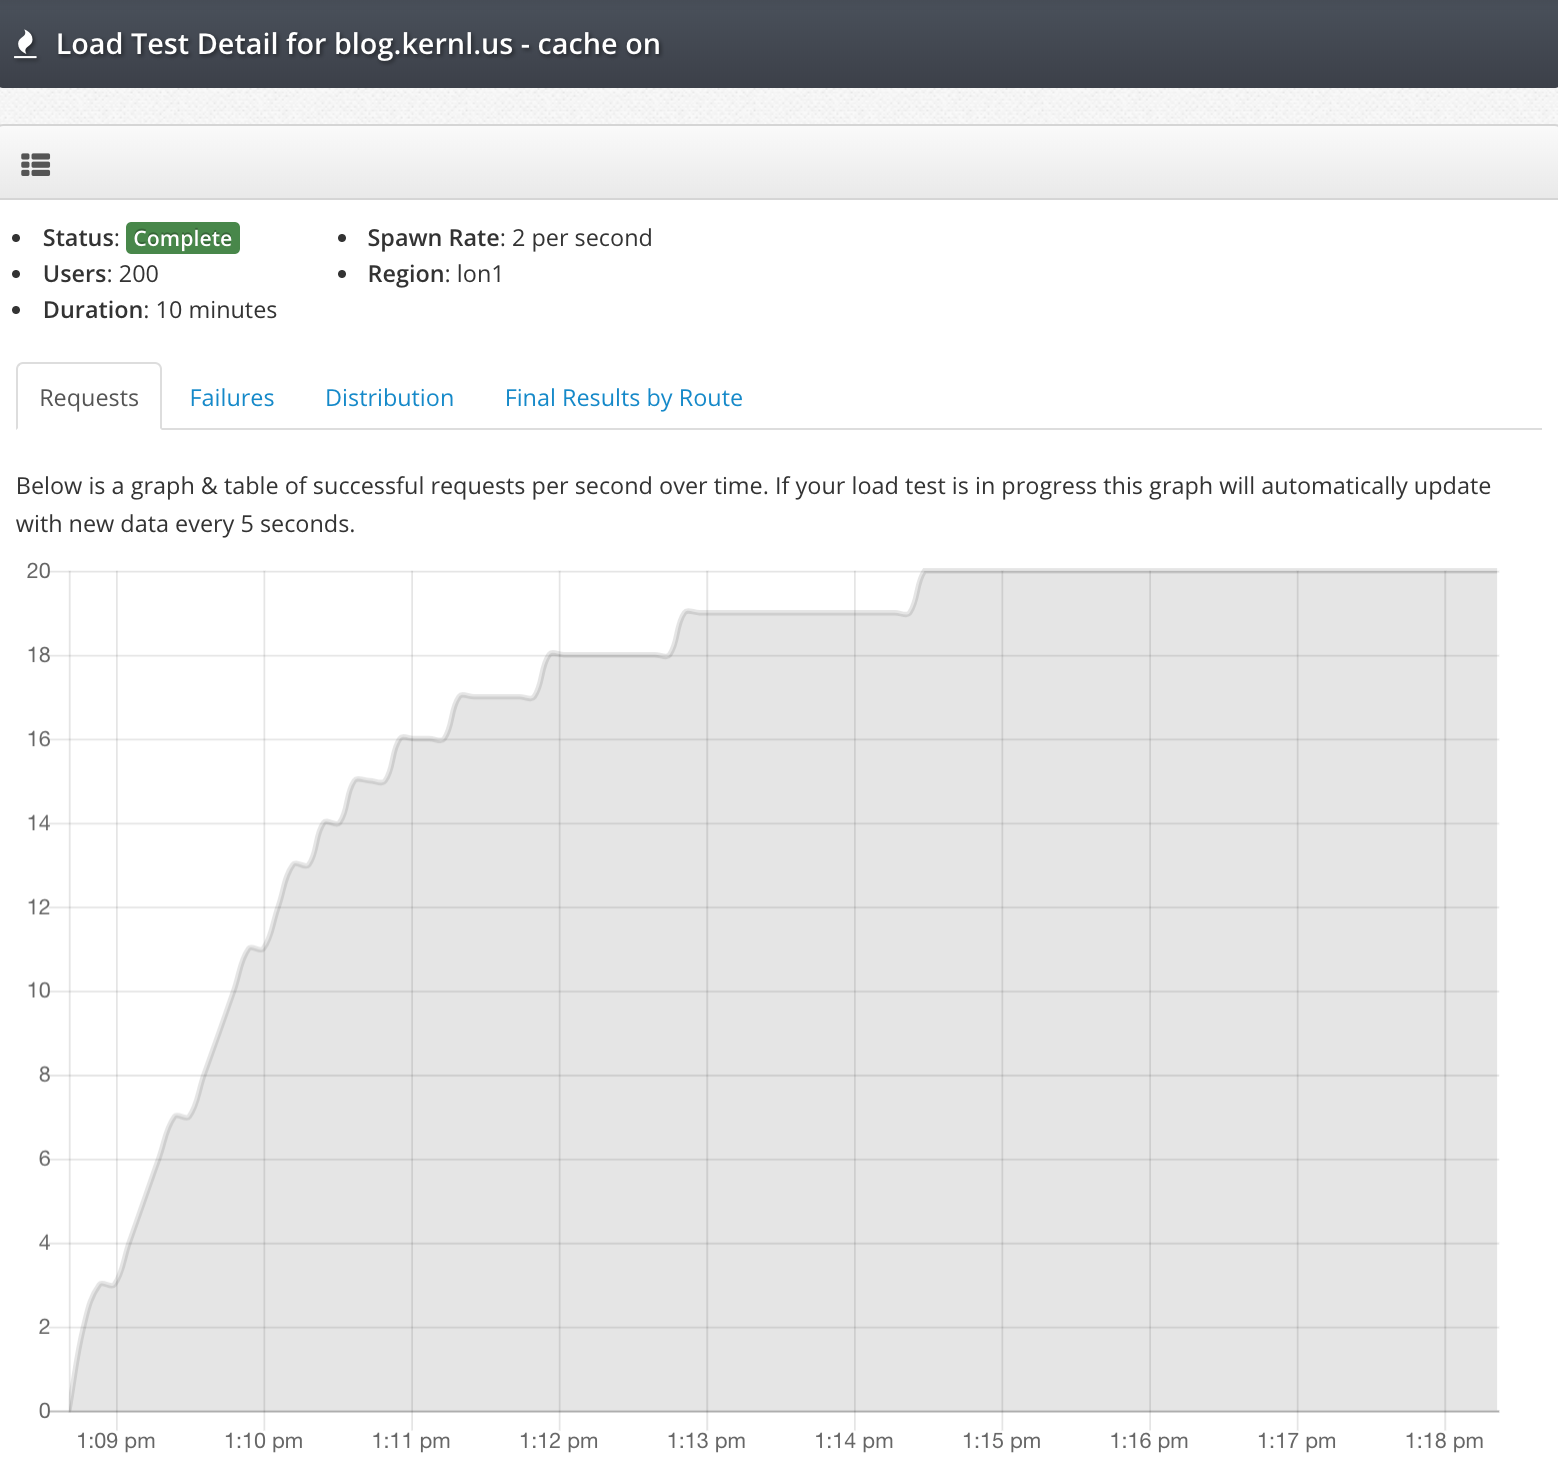
WOW! WP Super Cache made a huge difference in the throughput that the Kernl blog could handle. We maxed out at around 20 requests/s sustained which is a 10x improvement over our baseline sustained requests. And what about request failures?
Once again, pretty fantastic results. Through the entire load test only a single request failed. To put that number in to perspective a bit: 12,174 requests were made during the 10 minute load test. Only one failed. Thats a failure rate of 0.008%!
High throughput and low failures are great, but what about the distribution? If the user has to wait for 20 seconds for the page to load the site may as well be down. Lets check out the graph.
As you can see the distribution with caching enabled tells a very different story than without caching enabled. All requests finished in under 3 seconds and 50% of requests finish in under 2 seconds. Not perfect performance but certainly usable by an end user. Its also worth remembering a few things:
- This is a $5/month droplet on Digital Ocean.
- No server tuning was done.
- No WP Super Cache tuning was done.
- 20 requests/s is about 1.7 million requests per day.
Next time you need to test performance improvements to your WordPress site, be sure to check out Kernl so that you can be confident in your site’s ability to handle traffic.